Concept
The “iHyd” tool calculates the hydrologic inputs to BRAT (namely a baseflow statistic and a typical flood statistic). Since BRAT is not a hydrologic model (i.e. a model that takes precipitation and routes it as runoff across a watershed), we simply use regional curves to estimate a flow statistic for every reach. In other words, regional hydrological curves calculate high flow and baseflow stream power for each reach using the reach slope and upstream drainage area already calculated from the DEM. These regional curves take many forms, but generally relate discharge (y in figure below) to drainage area (x in figure below):
![[iHyd interface]](/assets/images/BRAT_3X_iHyd.PNG)
Figure 1: iHyd tool interface.
What you need
To populate the “iHyd” or hydrologic attributes to the input table you created in the previous step, regressions for predicting stream flow must first be developed or obtained for your model watershed, and then added to the model. For example, these regional curves are what drives USGS’s StreamStats Tool. Note, you can manually develop your own regional curves for areas they are not defined based on analyzing available gauge data.
Once you have the regressions for both a typical low flow (we often use the flow exceeded 80% of the time, usually labeled as “PQ80”) and a typical flood (we often use a two year recurrence interval flow, usually labeled as “Q2”), you may need to calculate values such as mean annual precipitation, mean basin elevation, and/or mean basin slope. These values can be calculated, respectively, using PRISM 30-year precipitation data, the project’s DEM, and the slope raster during the BRAT table step (found in your BRAT project folder > Inputs > 03Topography > DEM** > Slope).
Inputs and Parameters
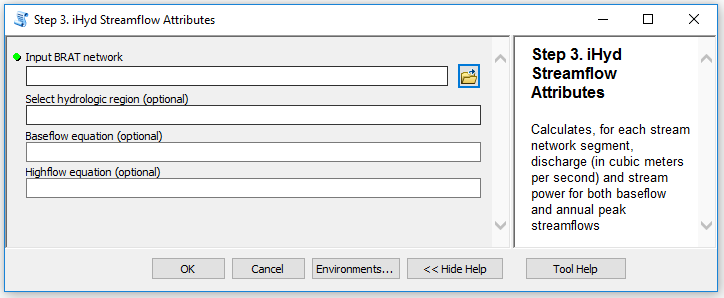
- Input BRAT Network - Select the network that was created using the BRAT Table tool.
- Select Hydrologic Region (optional) - Though not recommended, you can use example equations already included in the code. If you choose to do this, enter the region number here. Options are
101(Box Elder County, UT),102(Upper Green generic), and24(Oregon region 5). Both baseflow and highflow equations must be entered if this is left blank. - Baseflow Equation (optional) - Write the regional curve equation to be used to calculate baseflow stream power. The only variable that should be included in this equation is drainage area, written as
DAsqm. Any other variables must be replaced by numeric values calculated for the watershed being run. If entered, this will override the equation associated with the hydrological region specified above. - Highflow Equation (optional) - Write the regional curve equation to be used to calculate baseflow stream power. The only variable that should be included in this equation is drainage area, written as
DAsqm. Any other variables must be replaced by numeric values calculated for the watershed being run. If entered, this will override the equation associated with the hydrological region specified above.
After running, in addition to creating and calculating the iHyd fields, it will create a folder in 01_Intermediates called ##_Hydrology, which will contain layers symbolizing base flow and high flow stream power.
References
Examples of Estimating Flow Statistics from Regional Curves in Utah
- Kenney, T.A., Wilkowske, C.D., Wright, S.J., 2008. Methods for Estimating Magnitude and Frequency of Peak Flows for Natural Streams in Utah, U.S. Geological Survey, Prepared in cooperation with Utah Department of Transportation and the Utah Department of Natural Resources, Divisions of Water Rights and Water Resources.
- Wilkowske, C.D., Kenney, T.A., and Wright, S.J., 2008. Methods for estimating monthly and annual streamflow statistics at ungaged sites in Utah: U.S. Geological Survey Scientific Investigations Report 2008-5230, 63 pp.
 Back to BRAT Home